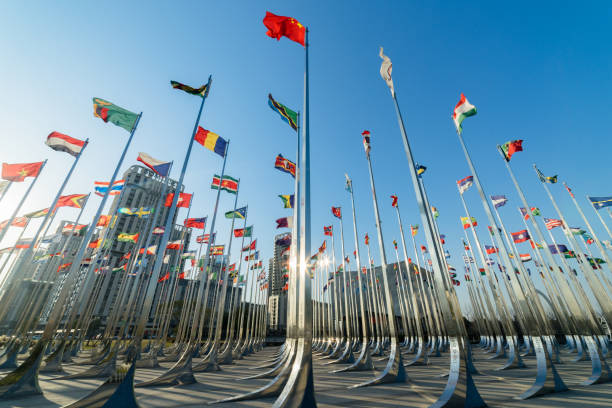
Flags of the Olympic Nations
The Olympics is a truly global event.

A culture like no other
The Olympics is the world's greatest cultural event.

The Olympic Rings
The Olympic symbol represents unity among all countries.
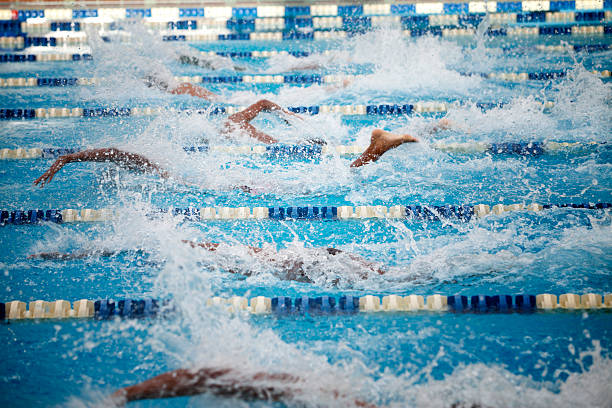
The Events
There are dozens of sporting events at the Olympic Games, swimming is our favorite.