This scatter plot shows the relationship between athletes' age and temperature difference in the context of medals won. Each point's size represents the number of medals won, indicating how age and temperature difference may correlate with Olympic success. In this graph we are looking at the distribution of Age to and Temperature difference, but what is really interesting about the graph is the sizing of the bubble is based off of the amount of medals that the individual athlete has, where the darker ones correlate to Gold medals and Lighter colors are Bronze or No medal. This is really interesting for us to see how different ages of olympic athletes perform given the temperature difference they were experiencing between their home and competing country.
Age Distribution of Olympic Athletes
This bar chart displays the distribution of athletes' ages, with ages ordered from youngest to oldest. The x-axis represents the age, and the y-axis shows the number of athletes of each age. This graph is simply showing the age distribution of all of the athletes data that we have collected. We can see that we have a normal distribution with the peak count being at 23 and 24 which we would expect being in the prime shape of their lives.
Age Distribution with Temperature Color Coding
In this visualization, the bars represent the number of athletes in each age group, and the color of each bar indicates the average temperature of the home countries of the athletes in that age group. This provides a dual insight into both the age distribution of Olympic athletes and the climatic conditions they are accustomed to. This graph is also showing the distribution of the athletes and their age, the difference with this is that the color of the bars is that of the average temperature of home country for all the athletes of that age.
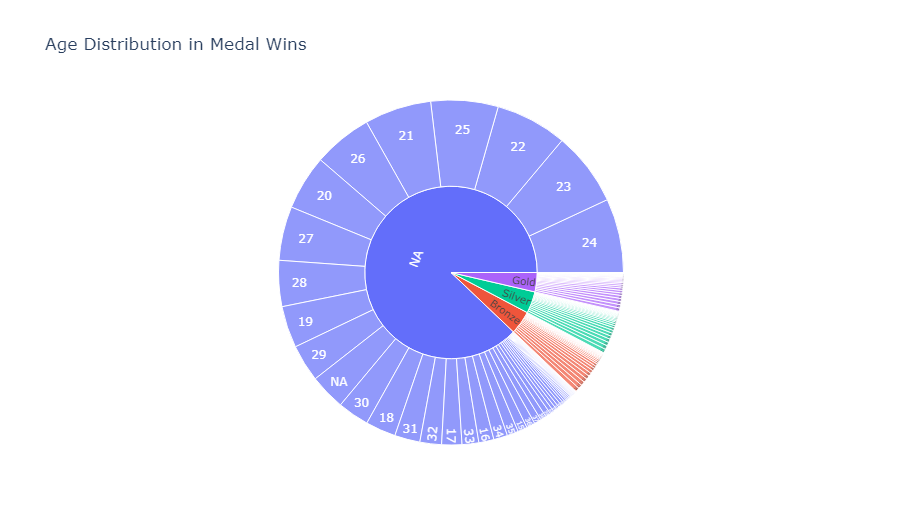
Pinwheel Distribution of Medal Winners by Age
This sunburst chart shows the distribution of medals across different age groups, giving an insight into which age groups are more successful in winning medals. This is a really interesting graph that shows us a few different things. The first that strike me is the different coloring of the pie chart, these different colors correlate to how you place in the olympics of Gold to not winning a medal. But also in this graph we can see the breakdown of the amount of athletes in their respective categories by age, with the slices being proportionate to how many athletes fall in that age.